


What is the amenity mix?
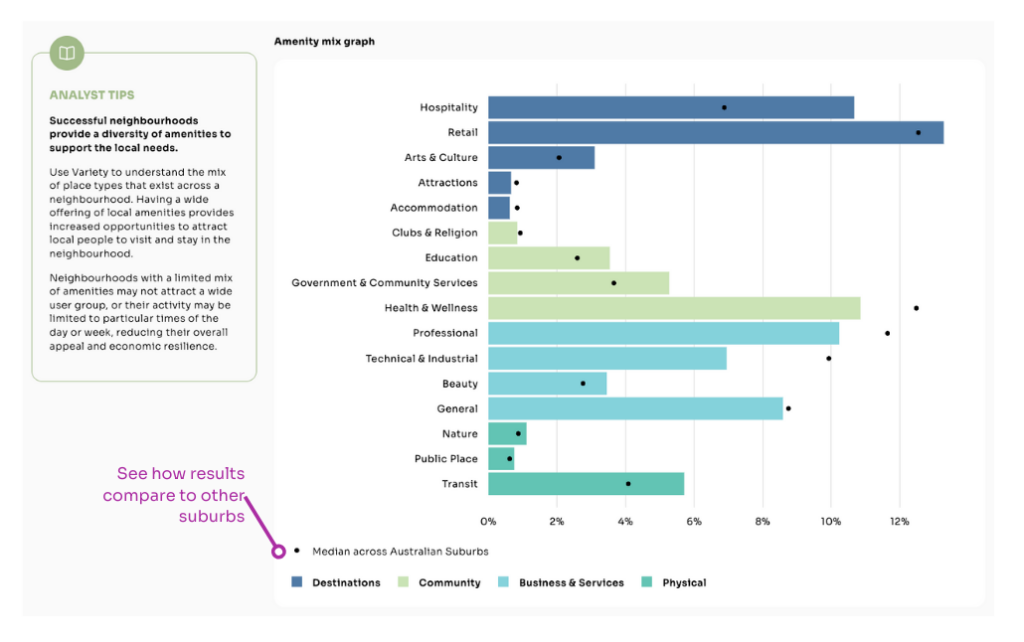
Where are the amenity gaps?
What is the day time vs night time economy?
What amenities are trading on week day vs weekends?
What are the most important places and stakeholders?
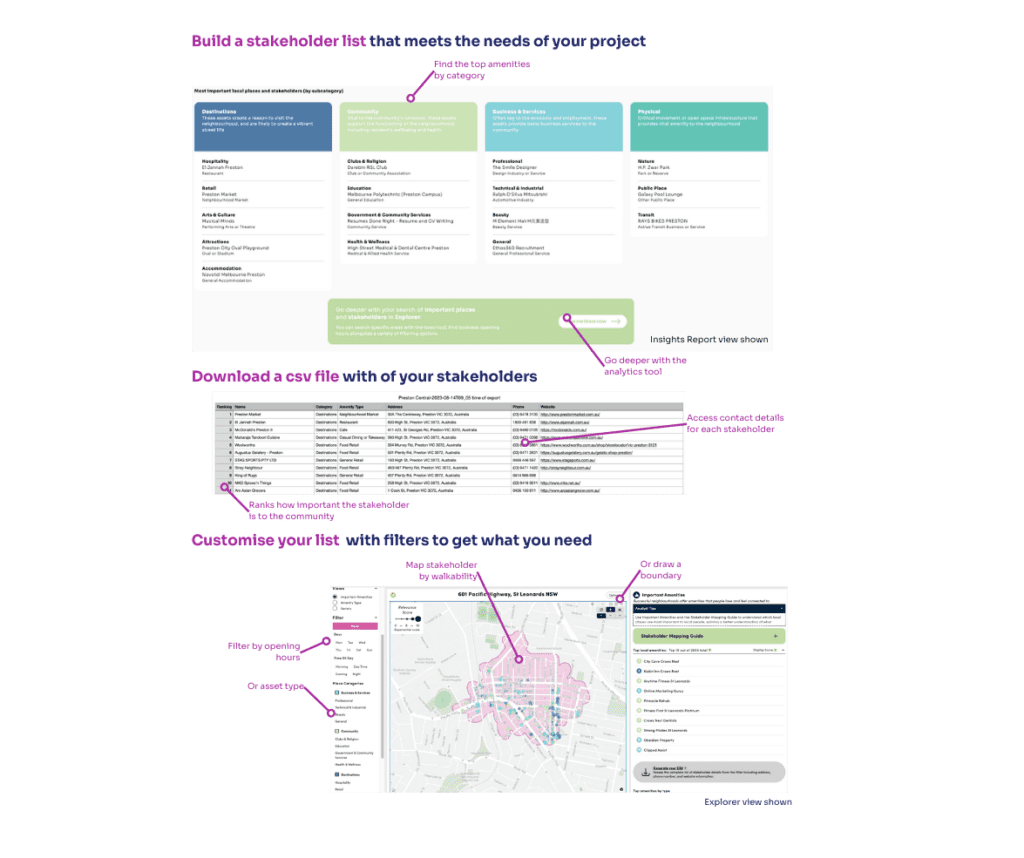 Who are the true local stakeholders?
What are the most valued community groups for our community strategy?
Who influences the local community?
How can I contact them?
What might be some of the social issues in this neighbourhood?
Successful neighbourhoods provide a diversity of amenities to support the local needs.
Having a wide offering of local amenities provides increased opportunities to attract local people to visit and stay in the neighbourhood.
Gaps in the amenity mix may indicate areas of improvement or further investment, while strengths may show the main reasons people visit the neighbourhood.
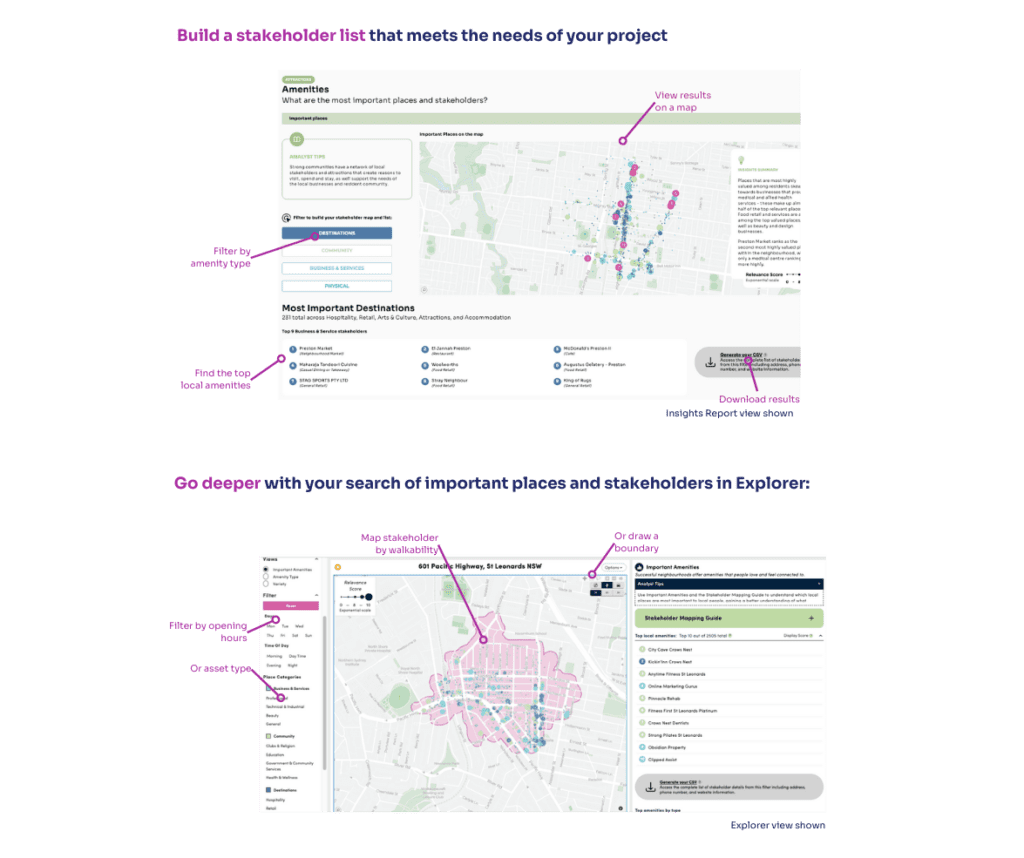
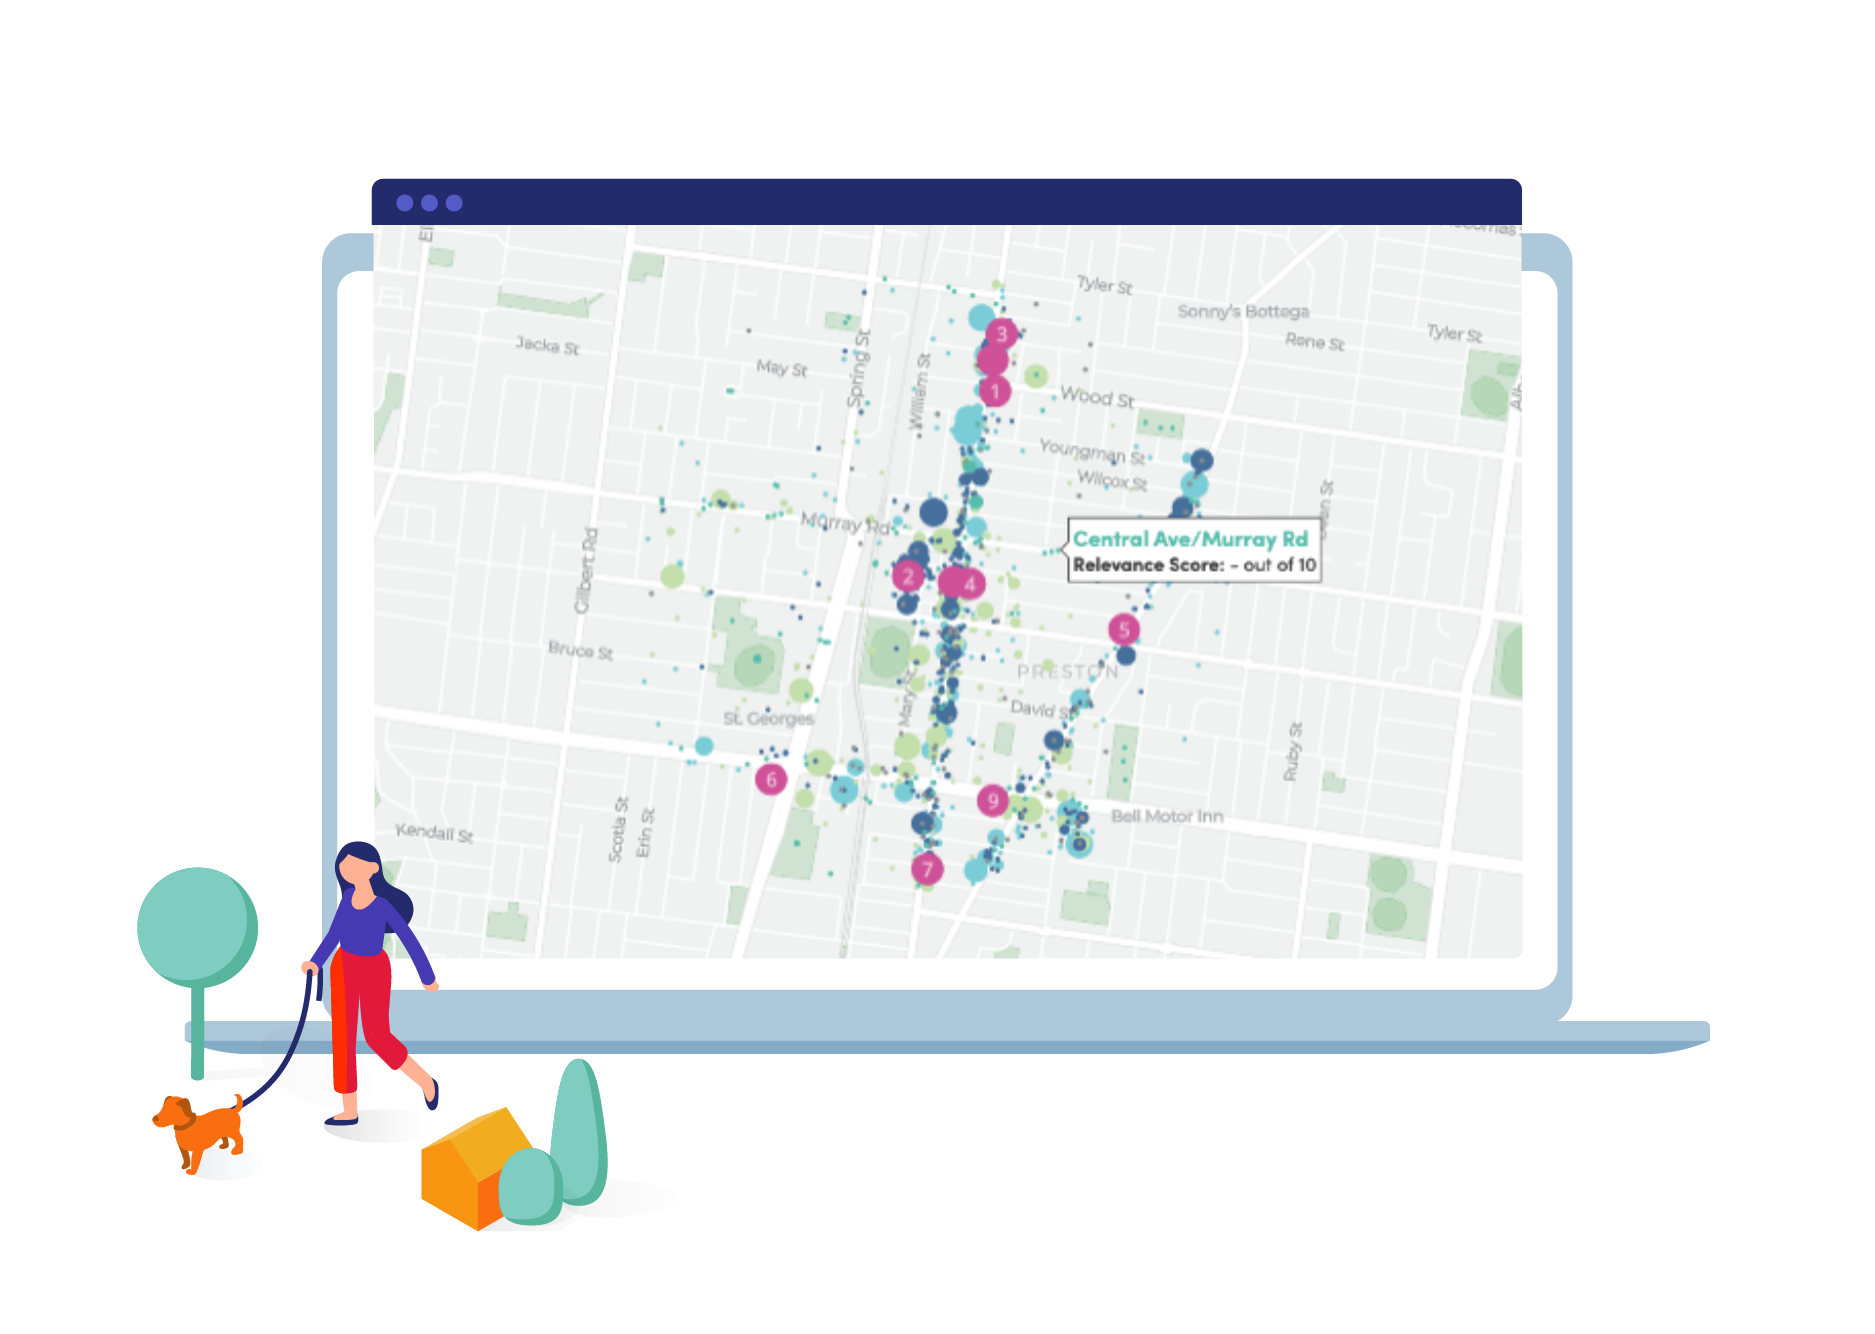
Our system generates fine grain points of interest maps by aggregating crowdsourced data . Each place is classified using our proprietary lifestyle taxonomy to understand its role within local life.
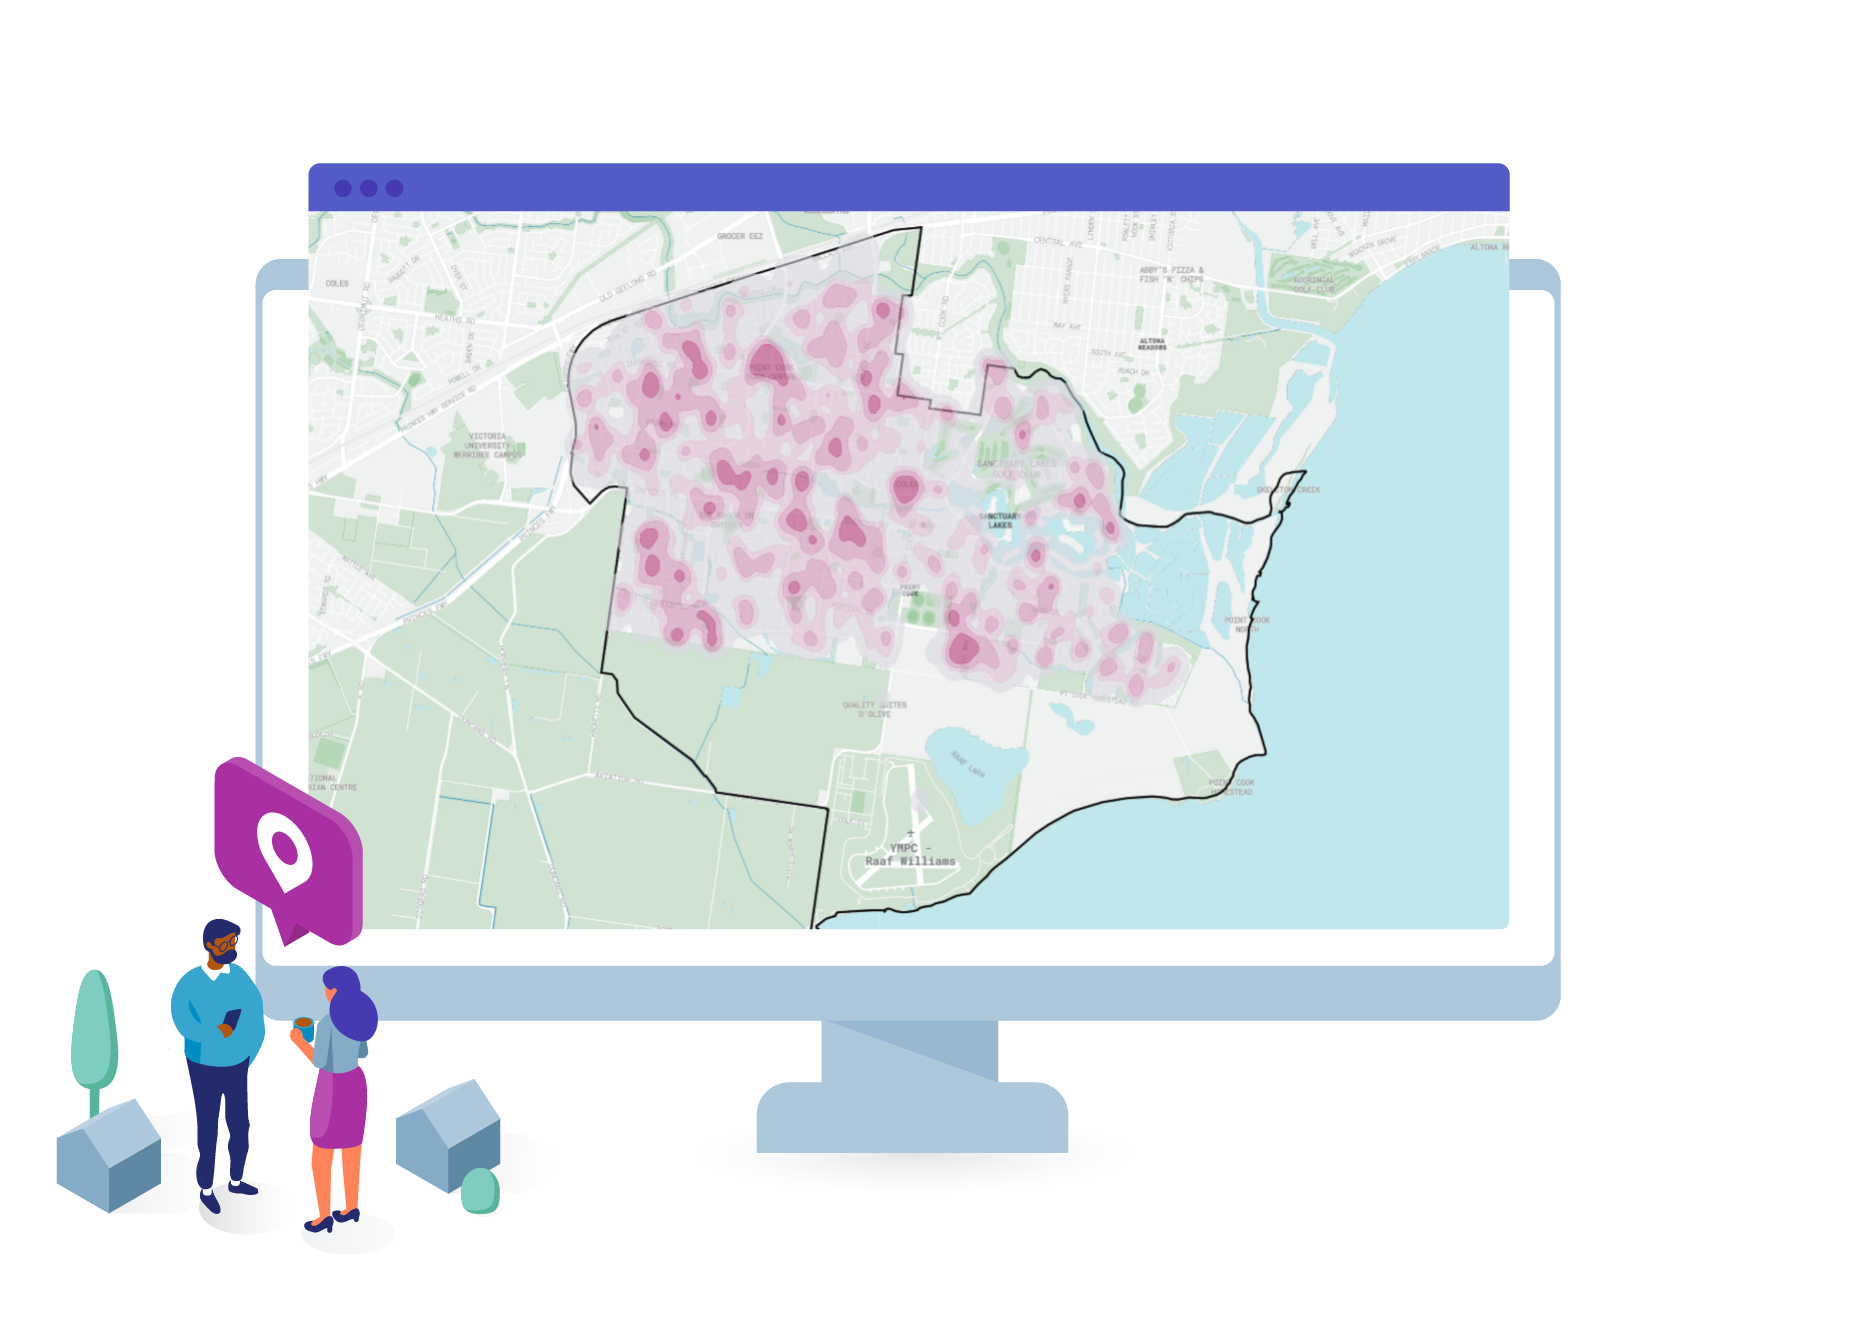
Where do people spend time?
What is the level of night time activity?
What are activity levels on weekends vs week days?
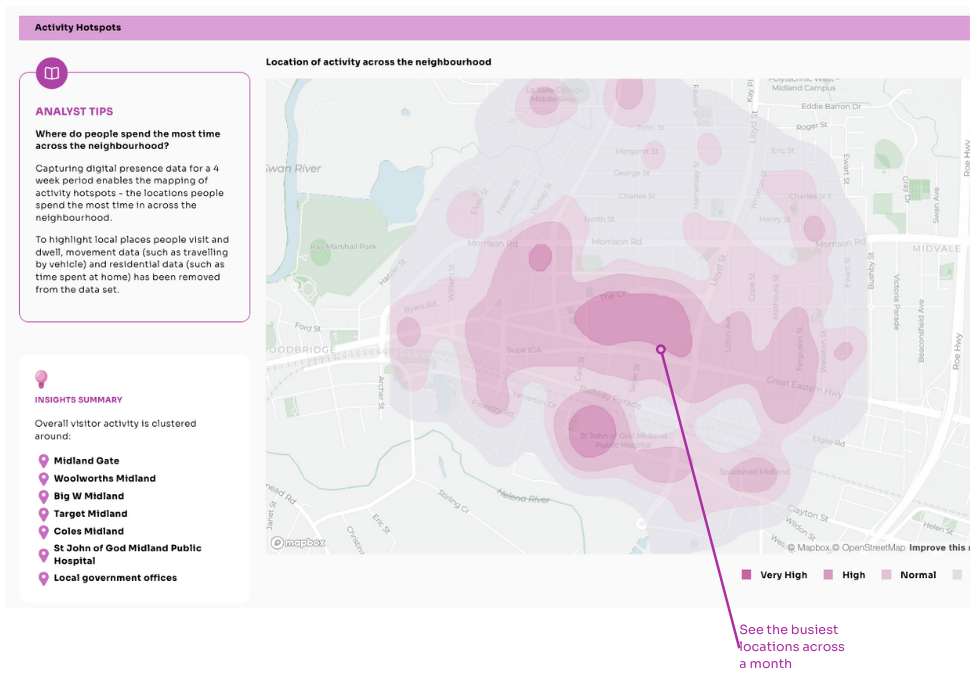
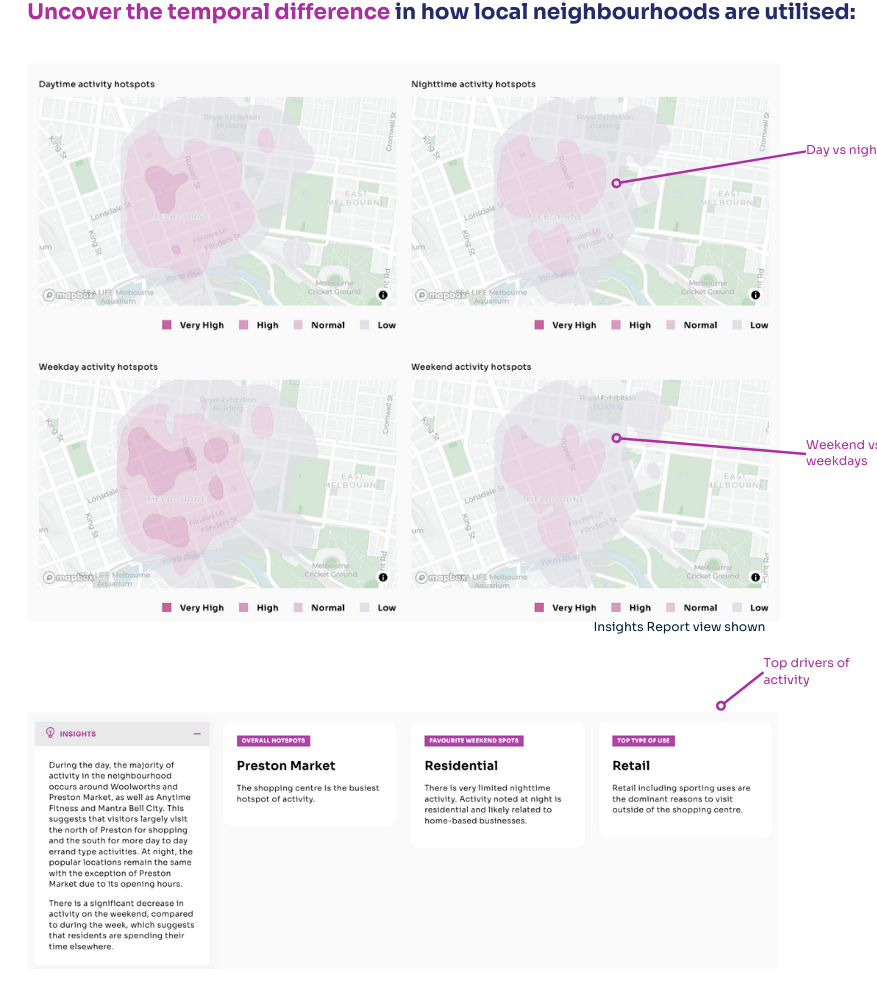
Capturing digital presence data for a 4 week period enables the mapping of activity hotspots - the locations people spend the most time in across the neighbourhood.
Mobile phone presence data is a vast resource for tracking the way people move through and around a neighbourhood. Careful cleaning and examining makes it possible to reveal the nuances of dwell behaviours across a neighbourhood.
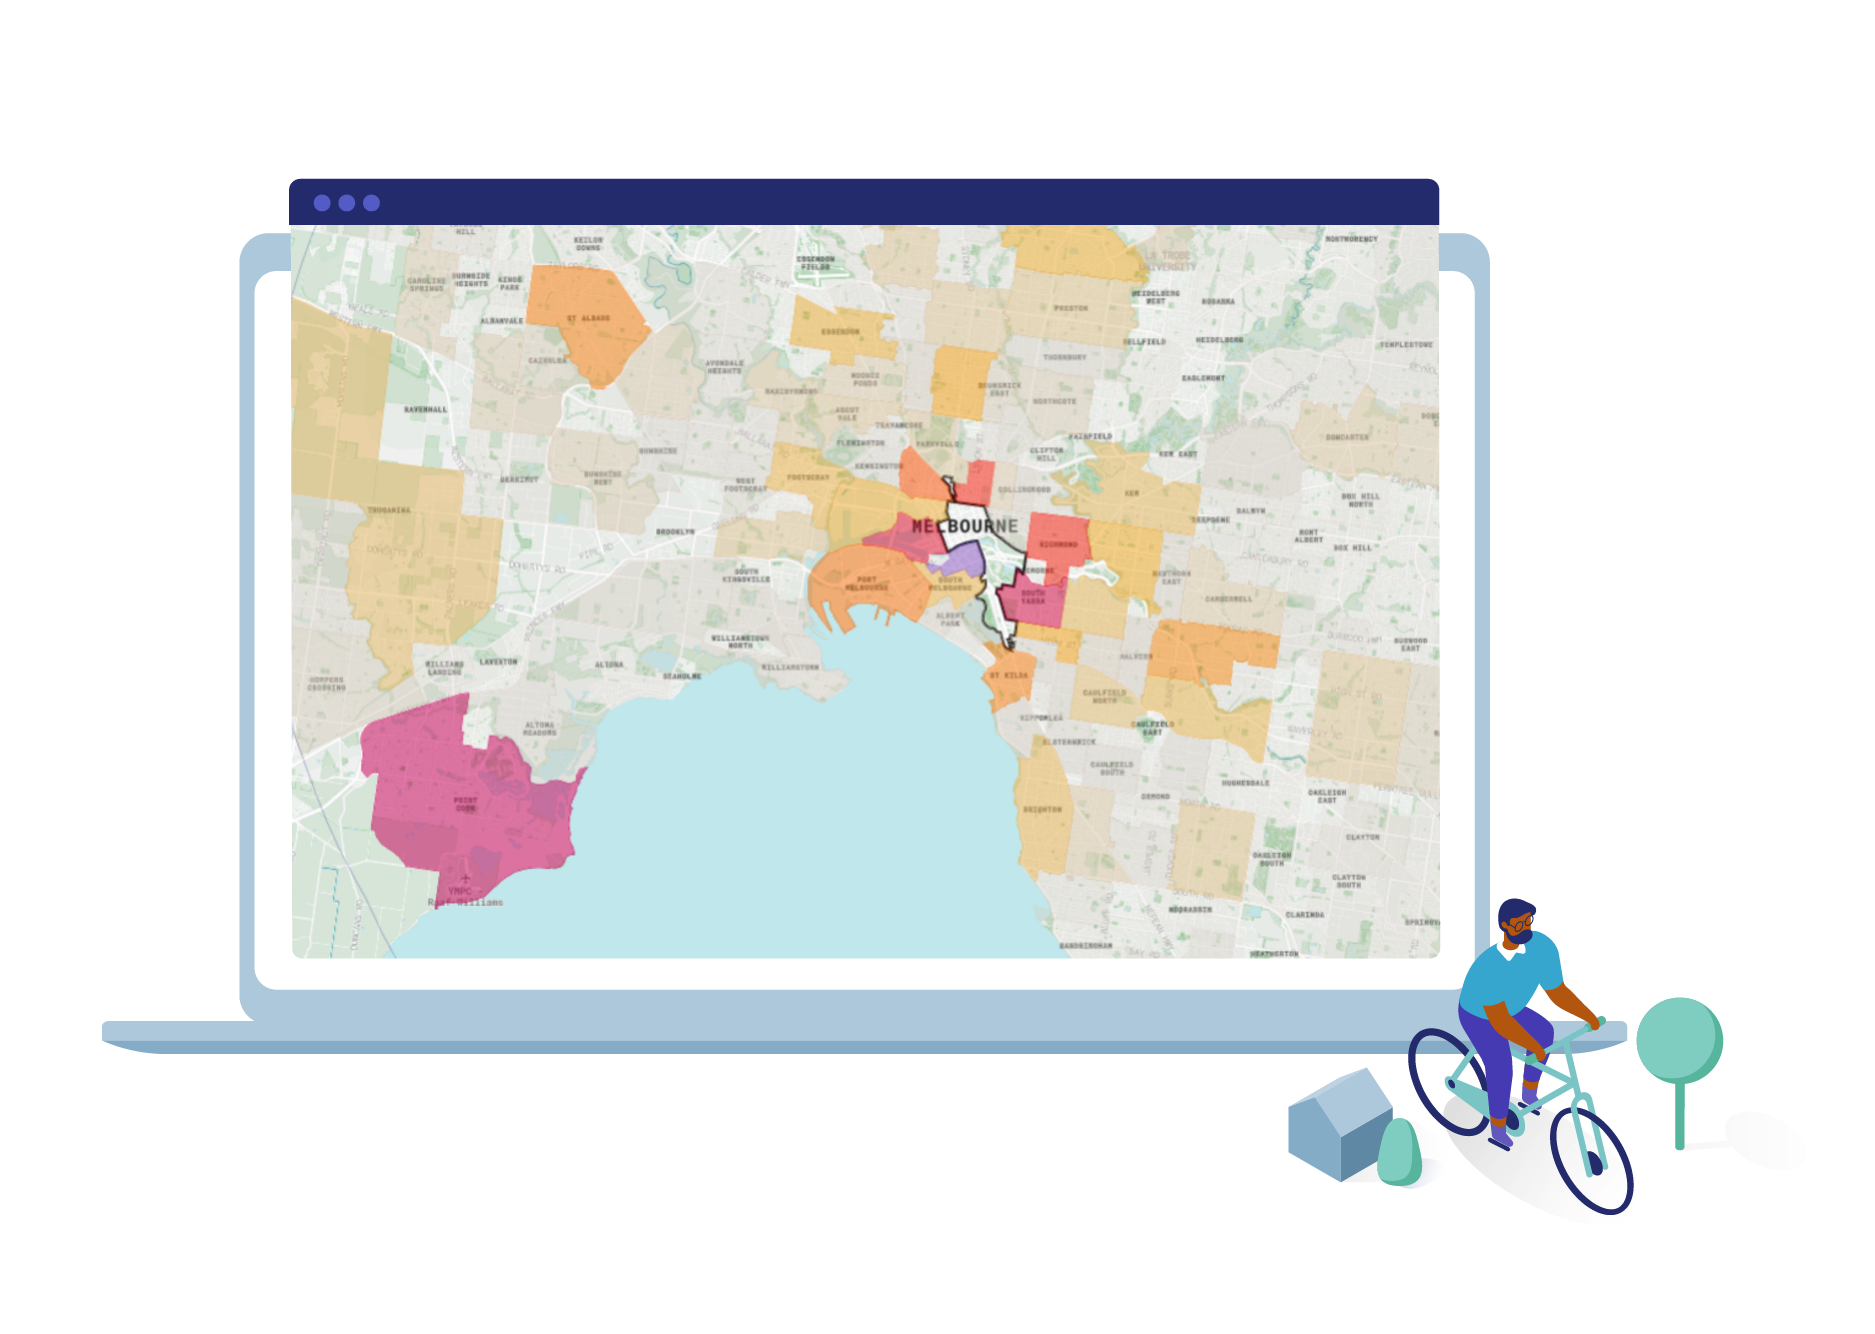
Where do visitors to the neighbourhood come from?
Where do residents from the neighbourhood visit?
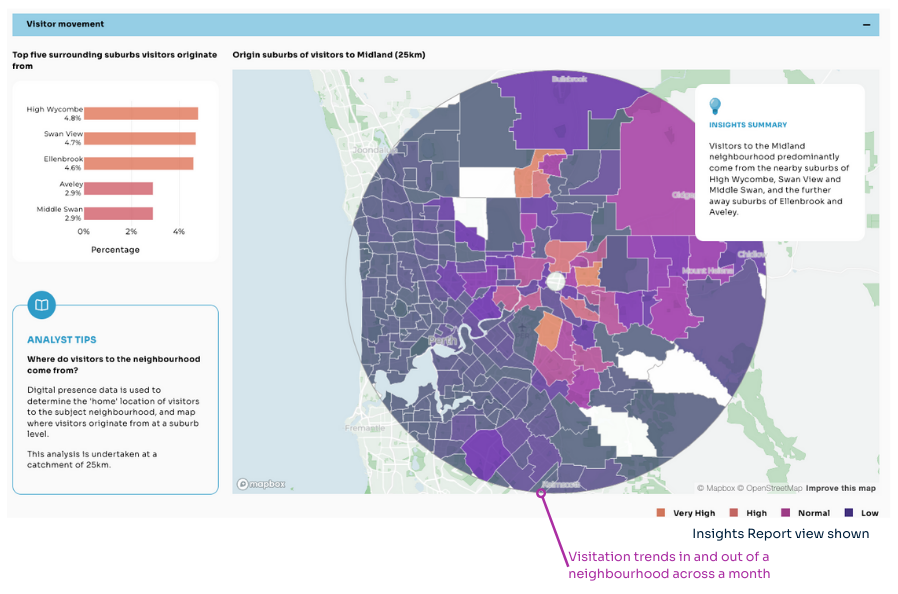
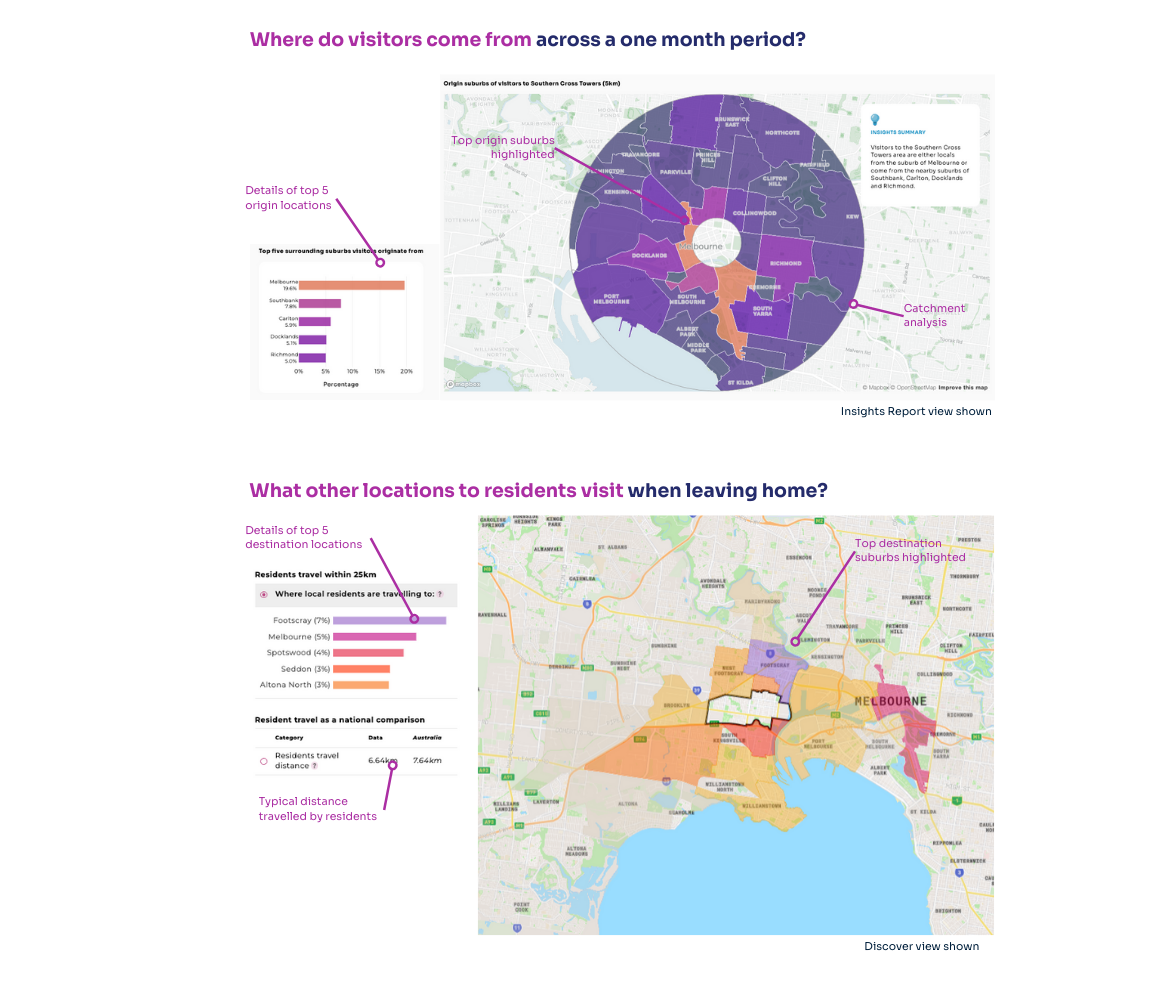
Digital presence data is used to determine the 'home' location of visitors to the subject neighbourhood and map the surrounding suburbs that local residents visit when the leave the subject neighbourhood. This analysis is undertaken at a catchment of 5km.
Understanding where visitors to a neighbourhood come from can highlight the attractors to a neighbourhood. Understanding where residents go can highlight amenity gaps allowing you to uncover opportunities to strengthen the catchment area or development.
Mobile phone presence data is a vast resource for tracking the way people move through and around a neighbourhood. Careful cleaning and examining makes it possible to reveal the nuances of visitation behaviours across a neighbourhood.
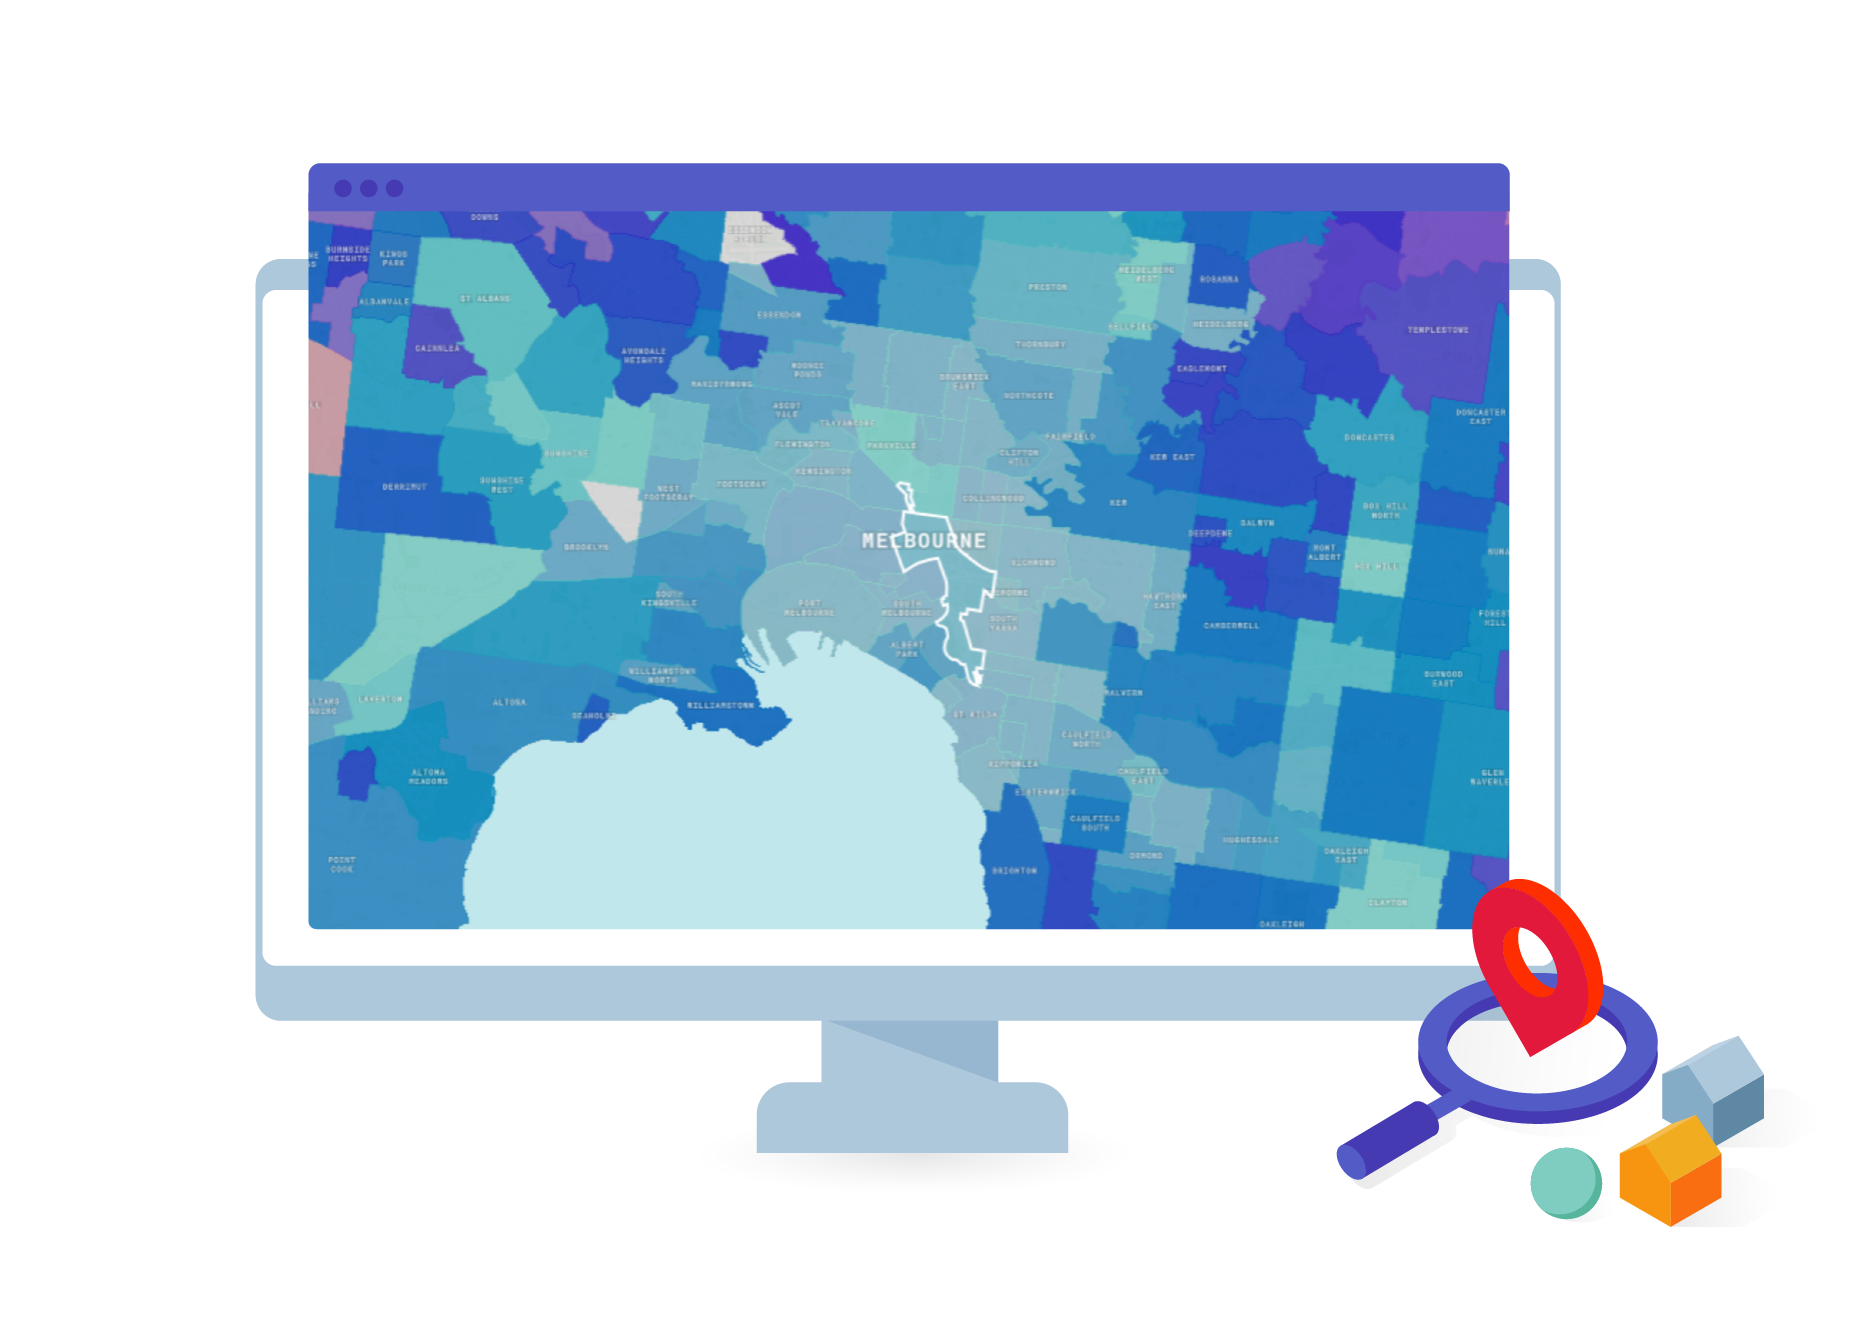
Who are the people that are likely to utilise the neighbourhood?
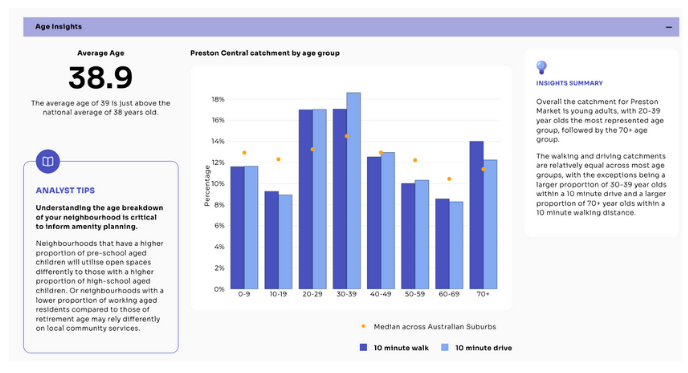
What is the age breakdown?
Who can access my neighbourhood within a short walk or short drive?
What can residents easily access on foot?
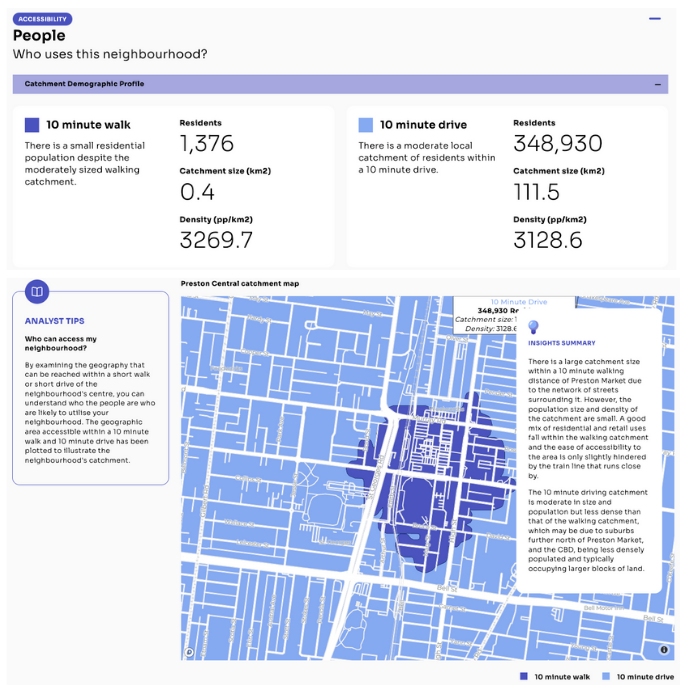
By examining the geography that can be reached within a short walk or short drive of the neighbourhood's centre, you can understand who the people are who are likely to utilise your neighbourhood.
Understanding the age breakdown of your neighbourhood is critical to inform amenity planning
Neighbourhoods that have a higher proportion of pre-school aged children will utilise open spaces differently to those with a higher proportion of high-school aged children. Or neighbourhoods with a lower proportion of working aged residents compared to those of retirement age may rely differently on local community services.
Mobile phone presence data is a vast resource for tracking the way people move through and around a neighbourhood. Careful cleaning and examining makes it possible to reveal the nuances of visitation behaviours across a neighbourhood.

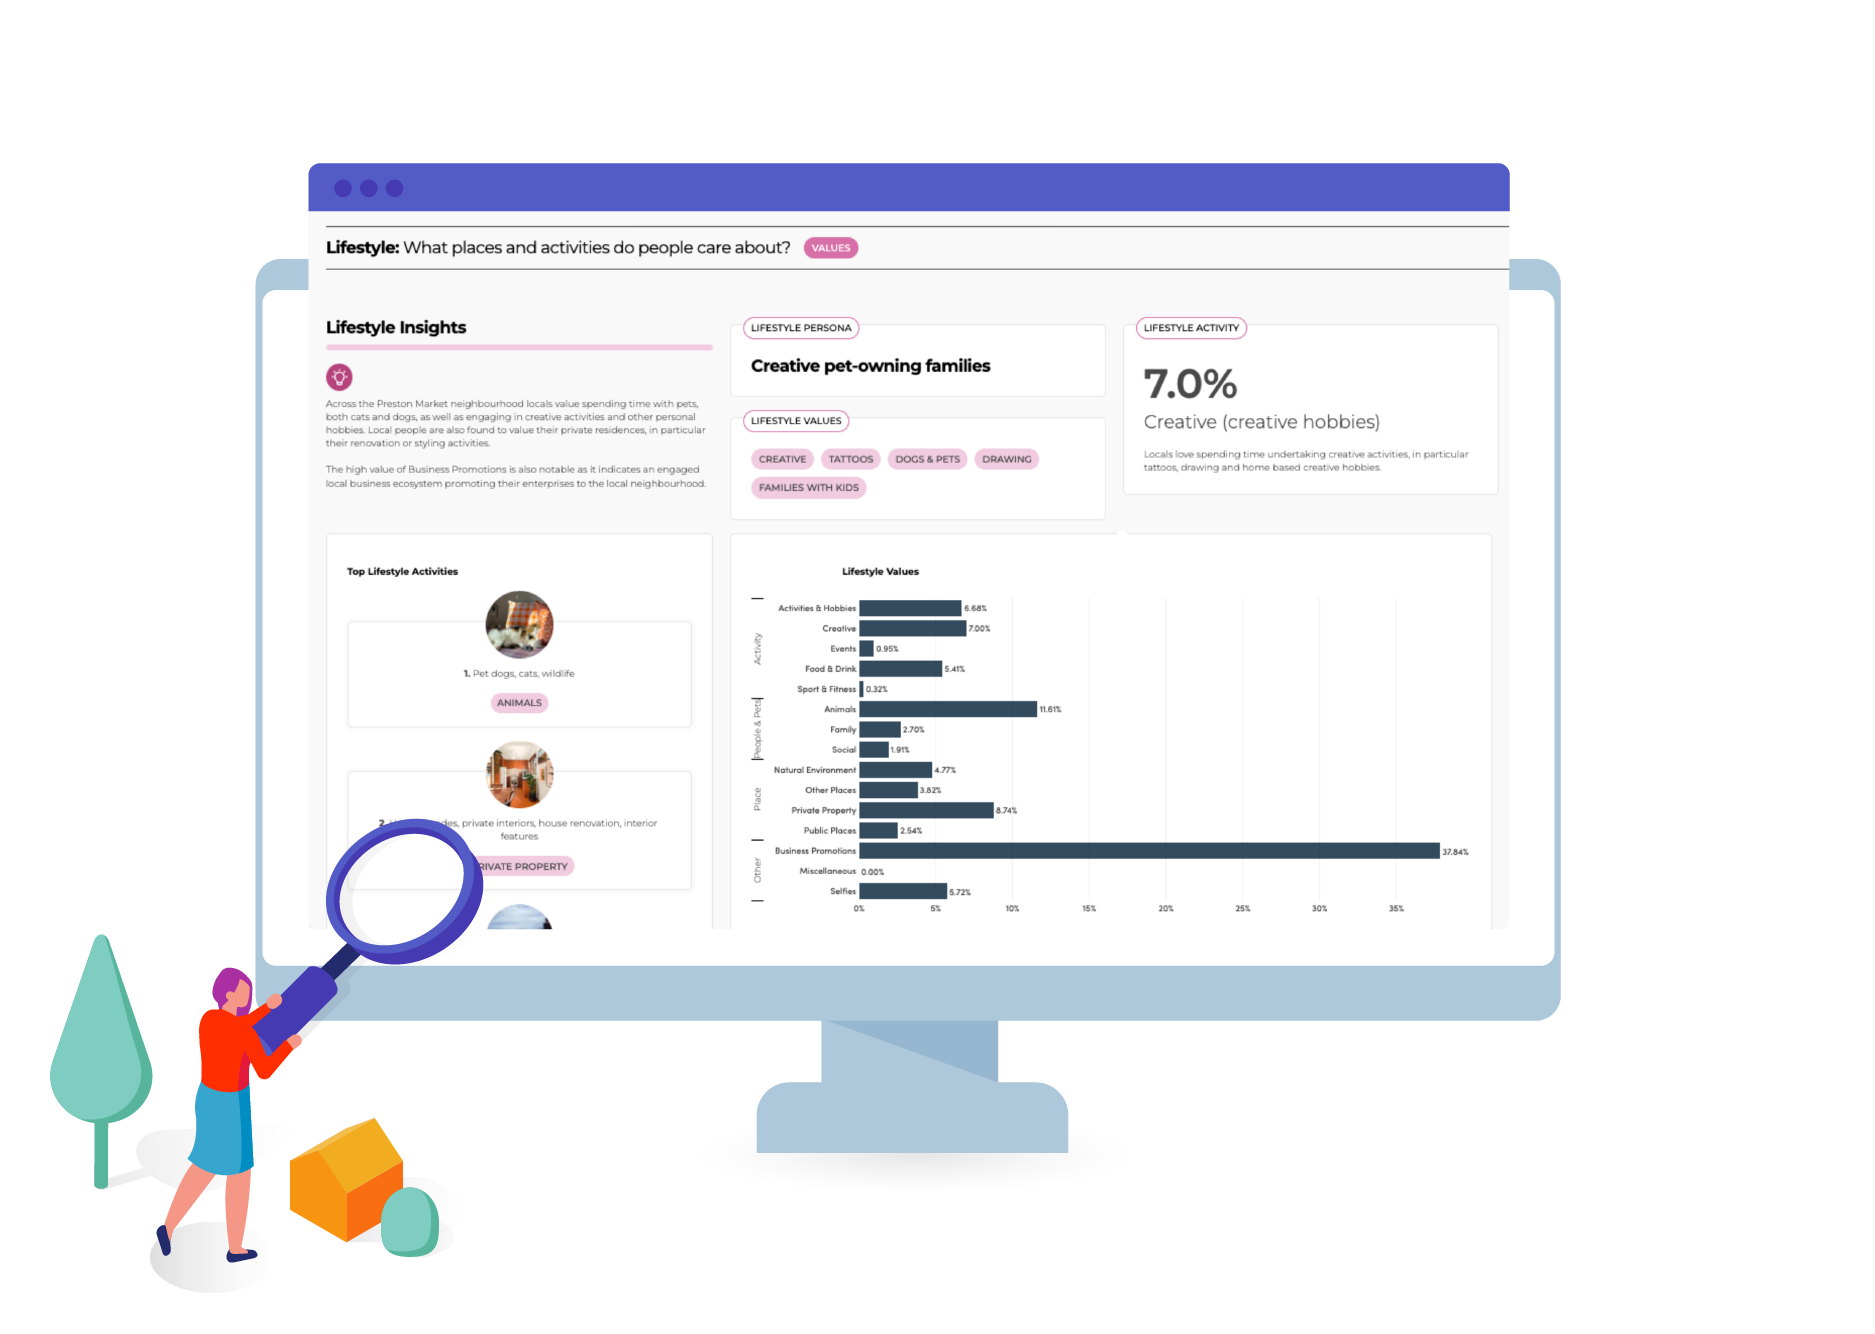
How do people love to spend their time?
What activities do people value?
How do people socially connect?
What local places do people love?
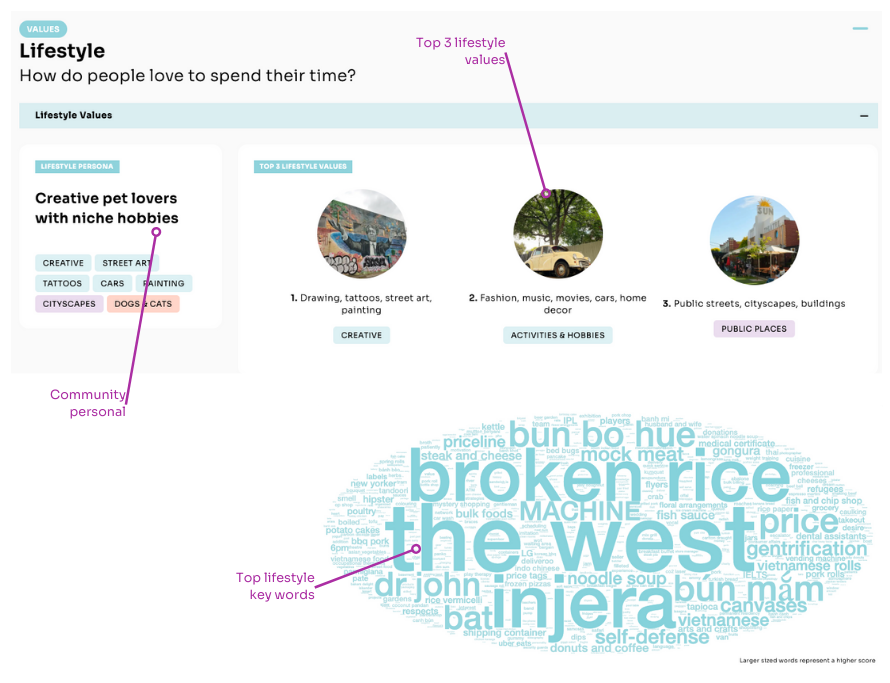
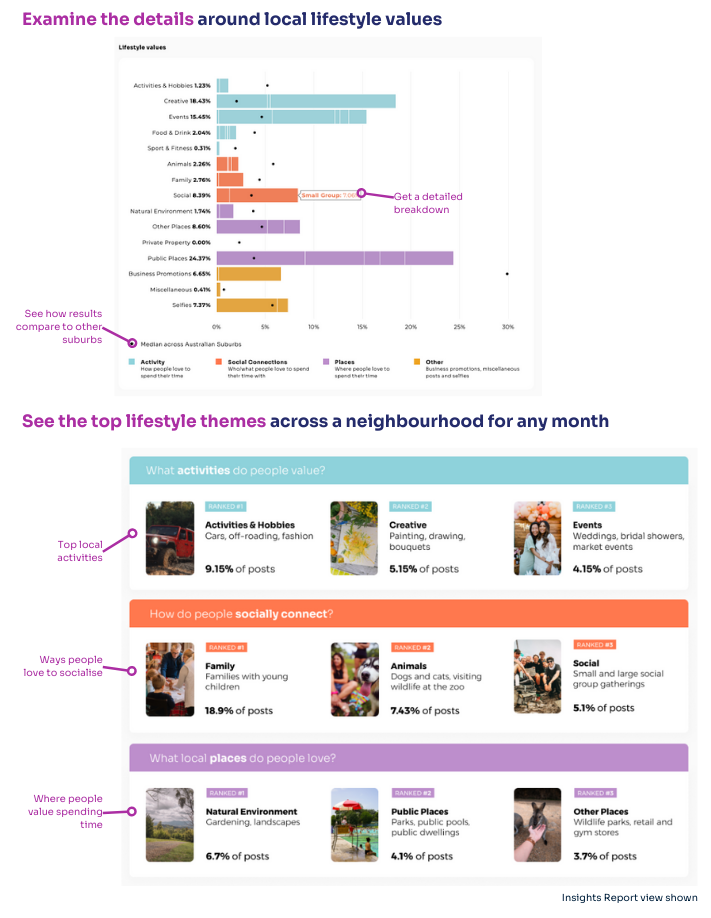
By examining local chatter at a neighbourhood level it is possible to gain insight into how people love to socialise, where they love to spend time, and what activities they love to spend time doing.
The way local people talk about their lives, and what they choose to post online about their experiences is a key indicator of local values.
Social media is full of chatter about the things people want their friends to know they did. This ‘bias’ reveals the shared lifestyle values across a neighbourhood in the previous 30 days.
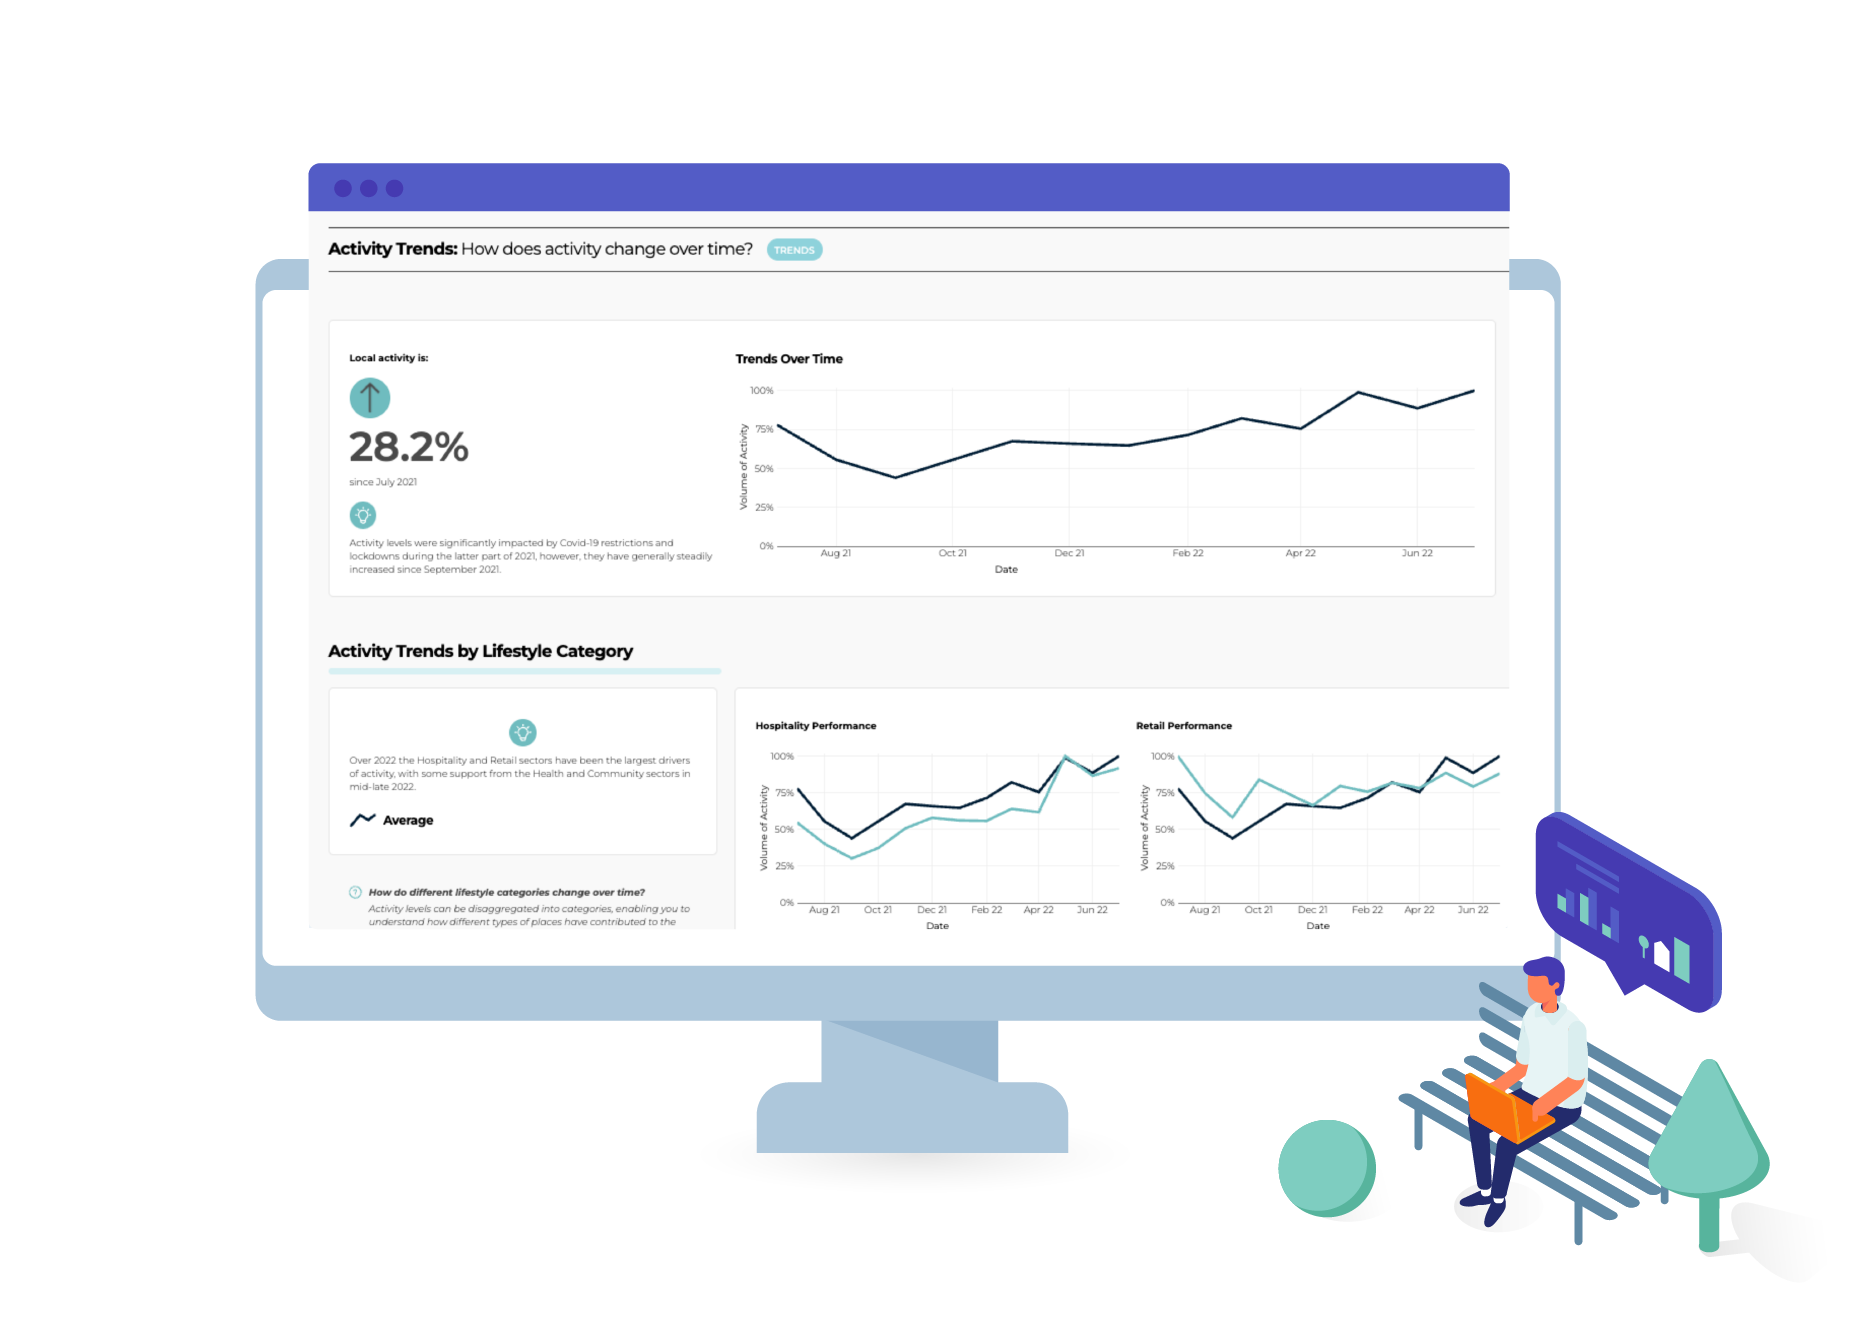
How does activity change over time?
What lifestyle categories are driving activity in a neighbourhood?
Where are the opportunities to improve activation and increase visitation?
Have physical changes to the precinct, activation or economic drivers altered behaviour?
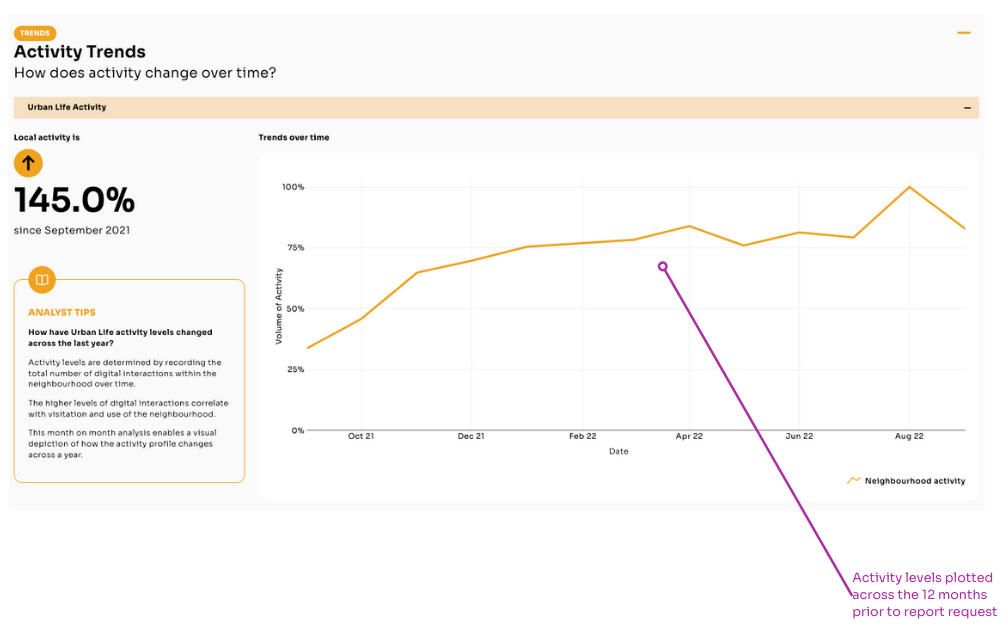
How have Urban Life activity levels changed across the last year?
Activity levels are determined by recording the total number of digital interactions within the neighbourhood over time.
The higher levels of digital interactions correlate with visitation and use of the neighbourhood.
This month on month analysis enables a visual depiction of how the activity profile changes across a year.
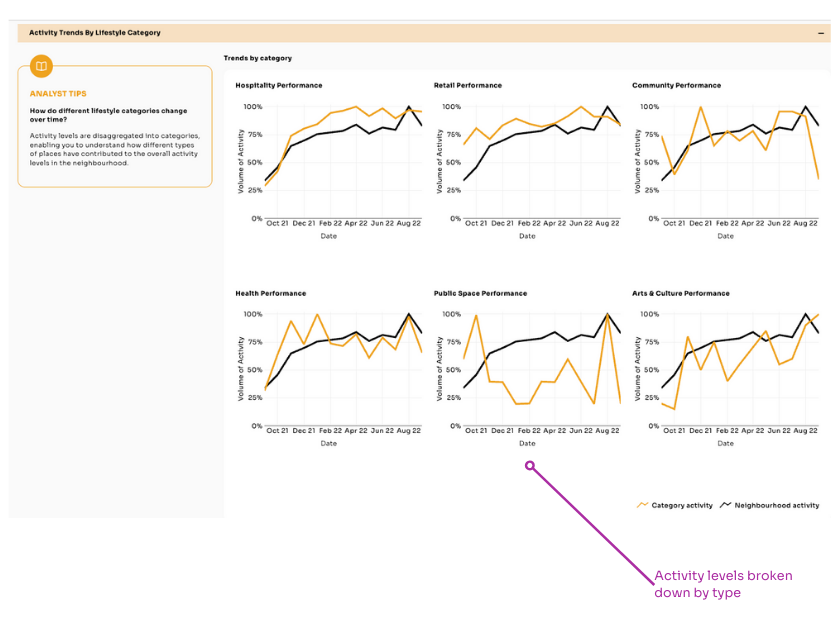
How do different lifestyle categories change over time?
Activity levels are disaggregated into categories, enabling you to understand how different types of places have contributed to the overall activity levels in the neighbourhood.
Tapping into unconventional digital sources such as ratings, reviews and social media posts, our lifestyle data can be tracked across time by plotting to velocity of digital interactions month by month.


